programming4us


Programming

Benchmarking Current Rankingstages of SEO

- Free product key for windows 10
- Free Product Key for Microsoft office 365
- Malwarebytes Premium 3.7.1 Serial Keys (LifeTime) 2019
11/28/2010 7:03:46 PM
The most fundamental objective of any SEO project should be to drive the bottom line. For a business this means delivering more revenue with favorable ROI. As a predecessor to determining the level of ROI impact, the SEO practitioner must focus on increasing the volume of relevant traffic to the site. This is a more important objective than anything related to rankings or number of links obtained. More relevant traffic should mean more revenue for the business (or more conversions for those whose websites are not specifically selling something).

Today’s web analytics tools make the gathering of such data incredibly easy. Two high-quality solutions are available that are completely free: Google Analytics (http://www.google.com/analytics) and Yahoo! Web Analytics 
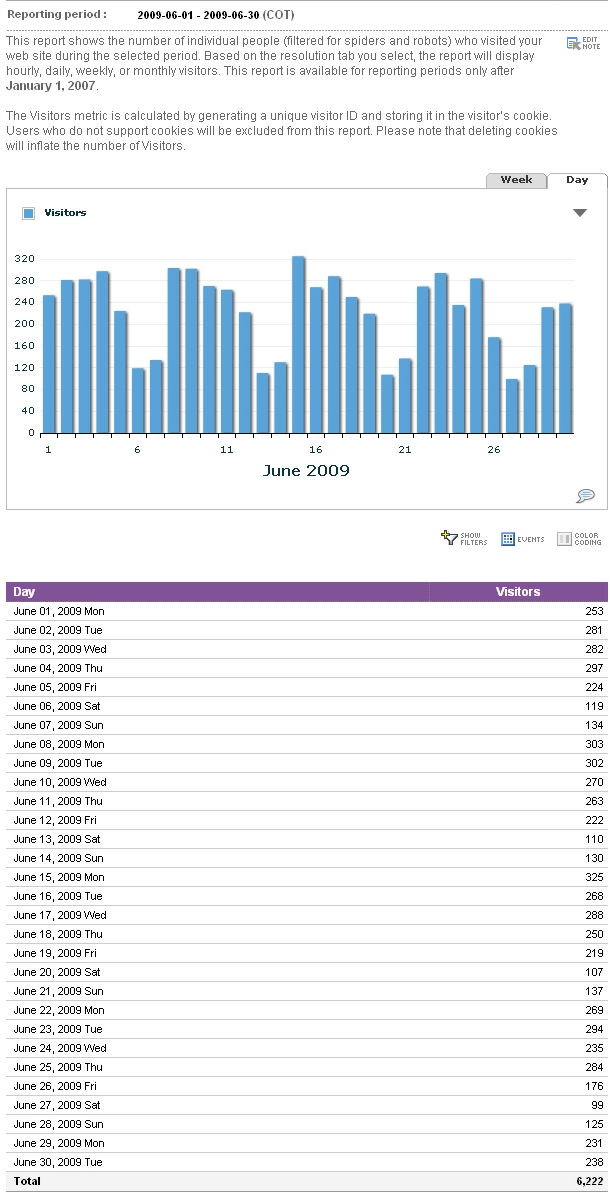
(http://web.analytics.yahoo.com/). Figure 1 shows a sample of basic “unique visitors” data from Yahoo! Web Analytics.

Figure 1. “Unique visitors” report from Yahoo! Web Analytics


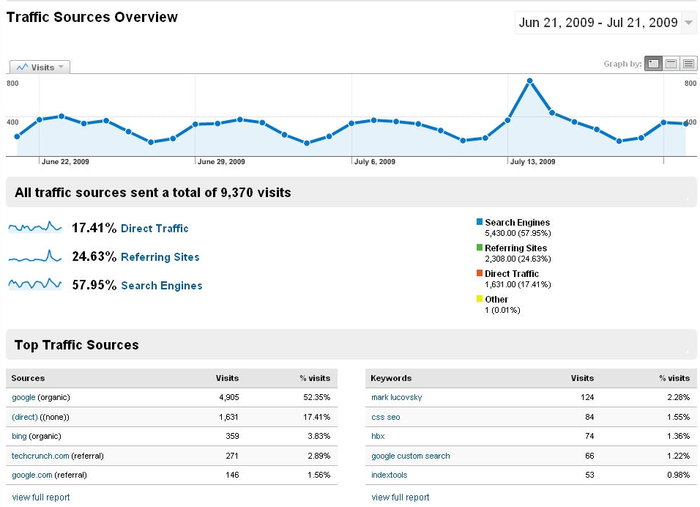
Digging a little deeper, you can see the sources of the traffic as well, as you can see in Figure 2, which shows a Google Analytics report.

As an SEO practitioner, it will be natural to want to delve into more detail—specifically, to break down the search engine traffic and understand that better as well. Once again, this is easy to do in both tools (and in most of the commercially available tools out there), as shown in the Google Analytics screen shot in Figure 3.

Figure 2. “Traffic sources” report from Google Analytics


Figure 3. “Search traffic” report from Google Analytics


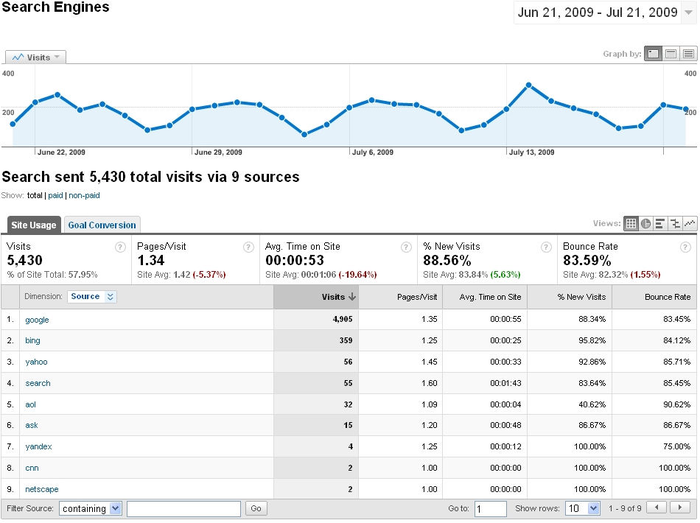
This type of data allows you to see which search engines are delivering the majority of the traffic, and perhaps flag potential problems. In Figure 4-16, Yahoo! and Bing seem unusually low for this site.

Also, over on the right of Figure 4-16 you can see that this site has an unusually high bounce rate. The site owner should probably work on some things to make the site a bit stickier.

Yet another thing to look at is which pages are getting the most traffic. Figure 4 shows a sample report on that from Yahoo! Web Analytics.

Figure 4. Yahoo! Web Analytics “most requested pages” report


In fact, the number of things you can look at in analytics is nearly endless. It is fair to say that there is too much data, and one of the key things that an SEO expert needs to learn is what data is worth looking at and what data is not worth looking at.
Other -----------------
- First Stages of SEO : Benchmarking Current Rankings
- First Stages of SEO : Benchmarking Current Indexing Status
- First Stages of SEO : Assessing Historical Progress
- First Stages of SEO : Determining Top Competitors
- Relevant IAM Standards and Protocols for Cloud Services (part 2)
- Relevant IAM Standards and Protocols for Cloud Services (part 1)
- Identity and Access Management : IAM Architecture and Practice
- Identity and Access Management : Why IAM?
- Identity and Access Management : Trust Boundaries and IAM
- Parallel Programming with Microsoft .Net : Parallel Tasks - The Default Task Scheduler
- Parallel Programming with Microsoft .Net : Parallel Tasks - Design Notes
- Parallel Programming with Microsoft .Net : Parallel Tasks - Anti-Patterns
- Parallel Programming with Microsoft .Net : Parallel Tasks - Variations (part 2)
- Parallel Programming with Microsoft .Net : Parallel Tasks - Variations (part 1)
- Parallel Programming with Microsoft .Net : Parallel Tasks - An Example
- Parallel Programming with Microsoft .Net : Parallel Tasks - The Basics
- jQuery 1.3 : The jQuery UI plugin library
- jQuery 1.3 : The Form plugin
- jQuery 1.3 : How to use a plugin
- jQuery 1.3 : Sharing a plugin with the world


Top 10
 
- Microsoft Visio 2013 : Adding Structure to Your Diagrams - Finding containers and lists in Visio (part 2) - Wireframes,Legends
- Microsoft Visio 2013 : Adding Structure to Your Diagrams - Finding containers and lists in Visio (part 1) - Swimlanes
- Microsoft Visio 2013 : Adding Structure to Your Diagrams - Formatting and sizing lists
- Microsoft Visio 2013 : Adding Structure to Your Diagrams - Adding shapes to lists
- Microsoft Visio 2013 : Adding Structure to Your Diagrams - Sizing containers
- Microsoft Access 2010 : Control Properties and Why to Use Them (part 3) - The Other Properties of a Control
- Microsoft Access 2010 : Control Properties and Why to Use Them (part 2) - The Data Properties of a Control
- Microsoft Access 2010 : Control Properties and Why to Use Them (part 1) - The Format Properties of a Control
- Microsoft Access 2010 : Form Properties and Why Should You Use Them - Working with the Properties Window
- Microsoft Visio 2013 : Using the Organization Chart Wizard with new data
- First look: Apple Watch

- 3 Tips for Maintaining Your Cell Phone Battery (part 1)

- 3 Tips for Maintaining Your Cell Phone Battery (part 2)
programming4us programming4us